Last week, we released the initial segment of this blog, which primarily covered the theoretical dimension of reporting. Presently, it’s time to get straight to the point and discuss the pragmatic approaches to implementing that theory.
Reporting Tools Available within HubSpot
One of the advantages of the HubSpot CRM platform is the powerful reports that come standard with each tool. Tools like Sequences in Sales Hub, Social or Traffic Analytics in Marketing Hub, Knowledge Base in Service Hub, and Website Pages in CMS Hub all have their reports covering those specific tools.
Here are the reporting tools available in HubSpot and how you can use them:
In-Tool Reports
Tools like Ads, Social Media, Sequences, Workflows, and Knowledge Base all have reporting dashboards or analyze tabs available. These tabs offer insights on common metrics associated with these tools such as impressions, open rates, conversions, etc.
These dashboards show the most common reports that anybody using these tools are likely to ask about the performance of the particular tool and actions you’re taking. While simple, these reports are powerful in helping determine which assets are performing and driving both traffic and conversions.
Analytics Tools
A powerful set of standard tools that show the analytics on sources of traffic, contacts and customers, lifecycle stage reports and more. These reports allow you to track the sales or service activity, understand which campaigns drive results, and track the changes in your recurring revenue.
These standard reports come standard within the relevant HubSpot packages/hubs as indicated below:
- Traffic Analytics (Marketing Hub Professional, Enterprise, CMS Hub Professional, Enterprise)
- Sales Analytics (Sales Hub Professional, Enterprise)
- Custom Behavioural Events (Marketing Hub Enterprise)
- Contact Analytics (Marketing Hub Professional, Enterprise)
- Campaign Analytics (Marketing Hub Professional, Enterprise)
- Sales Content Analytics (Sales Hub Professional, Enterprise)
- Form Analytics (Marketing Hub Professional, Enterprise, CMS Hub Professional, Enterprise)
- Revenue Analytics (Sales Hub Enterprise)
Custom Reports: Single Object
Analyze contacts, companies, deals, tickets, custom objects, activities, line items, or feedback submissions.
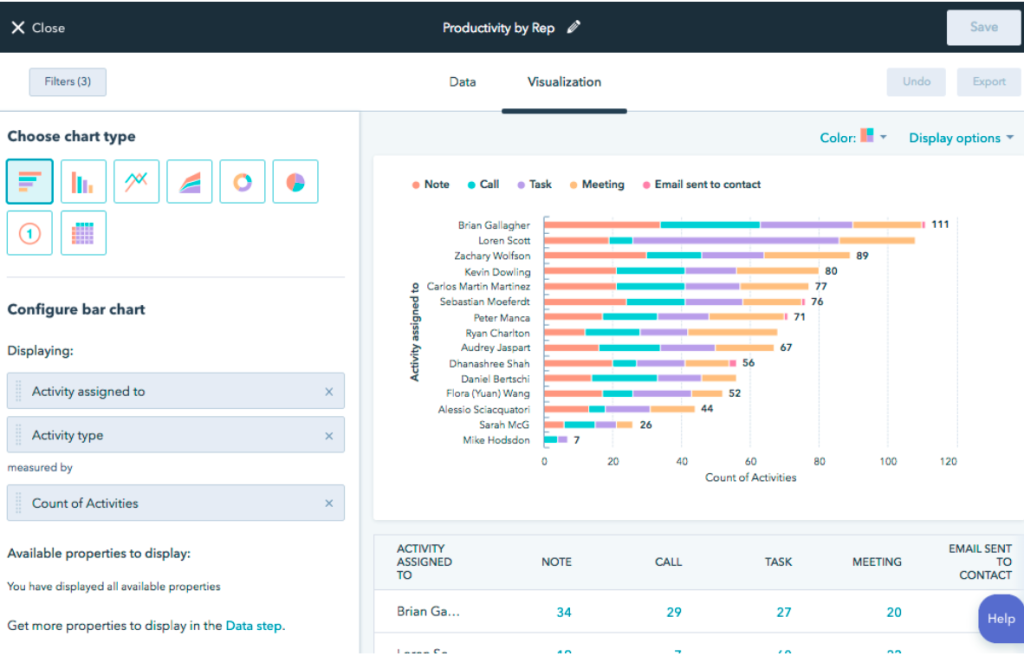
Custom Reports: Single Object
Custom Reports Builder
An advanced report builder that enables you to analyze objects concerning marketing, sales, and service activities.
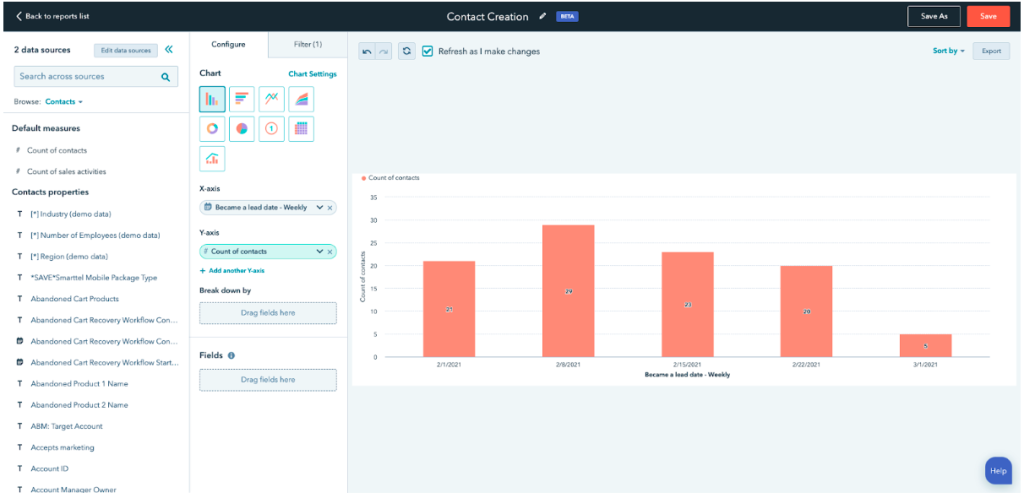
Custom Reports Builder
Funnel Reports
Measure the conversion rates between certain stages in a customer’s lifecycle or deal’s pipeline. If you have an Enterprise subscription, you can also create a custom events funnel.
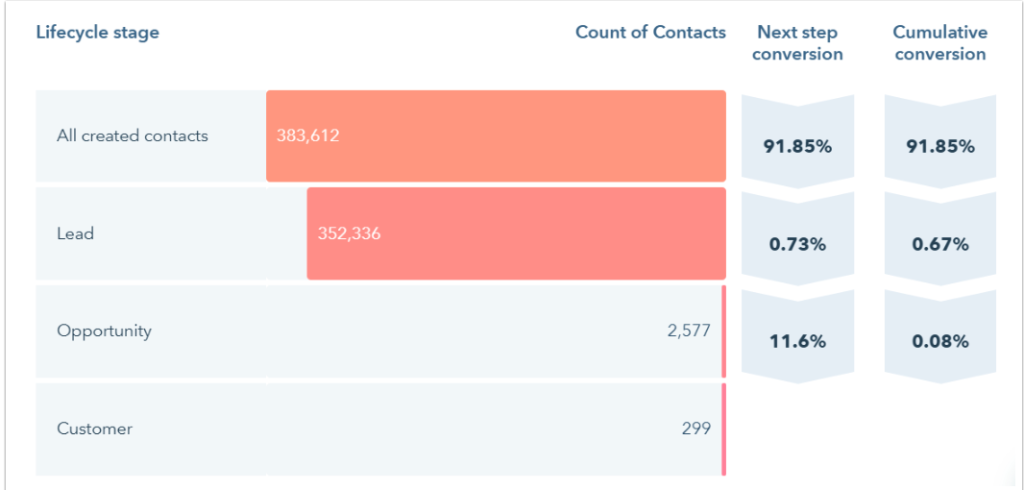
Funnel Report
Contact attribution report
Measure which sources, assets, and interactions impacted lead generation (Marketing Hub and CMS Hub Enterprise only).
Contact attribution report
Deal create attribution reports
Measure which sources, assets, and interactions impacted deal generation (Marketing Hub Enterprise only).
Deal create attribution reports
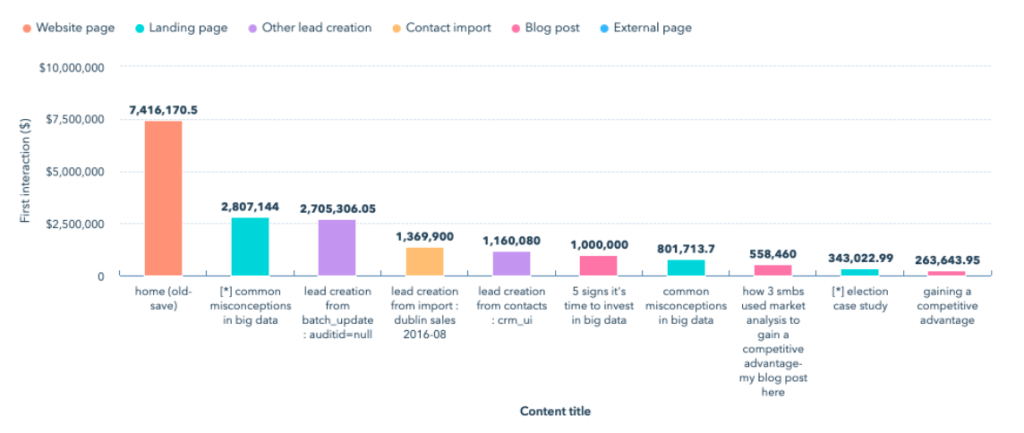
Revenue attribution reports
Measure which sources, assets, and interactions had the greatest impact on revenue (Marketing Hub Enterprise only).
HubSpot Dashboards
Know why you’re creating your dashboard
When it comes to building a data dashboard, ask yourself, “what problem does this board need to solve?” Forcing a dashboard when one isn’t needed is a great way to waste time and resources. Understand the purpose behind your board, your goals then what necessary metrics you need to identify, measure, and improve.
To start, focus on five to ten most important metrics and report on those per dashboard. If you do, you’ll have a clear understanding of when you’re adding value to the problem and when you’re not and will help tell the true story to stakeholders.
Not all clients are created equal. They come in many shapes and sizes and are often looking for different metrics depending on their department. Defining your target onlookers will help you:
- Ensure you’re creating the right board, for the right people.
- Better understand how to communicate and act on the right data.
- Increase the likelihood the dashboard will be well-received.
Start by asking yourself a few questions:
What problems does this board need to solve?
Most teams have some understanding of why they exist. Your data dashboard should be related to that purpose and align with the target group’s overall objectives.
What metrics are most important to the target group?
Choosing the right metrics depends on many factors like the type of offering or product, business model (B2C/B2B), industry (e-commerce/SaaS), job function (product/marketing/sales), and more.
What does the group stand to gain from this dashboard?
Great metrics lead to insights — which lead to actions and results. Write down what clarity observers will walk away with after looking at the board.
Once you answer the questions above, you’ll have a better idea of who’s looking at your dashboard and can determine how in-depth you need to go with tracking.
Building great dashboards
Layout: How You Distribute Content on the Page
- Break up the text into short paragraphs and bulleted points so that it’s easy to skim (no “wall of words” to discourage your readers).
- Keep the layout simple and uncluttered, with plenty of margin and white space (blank areas that give the eyes a chance to rest).
- Left justify the text to make it easier to read. Readers sometimes overlook titles that are centred.
Font Size and Type
- Make the text large enough for easy reading and choose highly readable fonts. Serif fonts have little strokes at the ends of letters; sans serif fonts do not.
- For Web reports, experts usually recommend using a sans serif font for easy on-screen reading.
- For printed reports, experts tend to recommend using a serif font for the main text and a sans serif font for headings, subheadings, and labels. Choose serif and sans serif fonts that are both easy to read and contrast well with each other.
- Use boldface type to highlight important words and phrases. But use it sparingly, because large blocks of text in bold are hard to read.
Font Color and Contrast
- Maintain high contrast between the text and background. Black text on a white or very light background is the most readable text.
- Be cautious with colored text. Never put text in light colors such as orange or yellow against a light background.
- Minimize use of “reversed-out” text (light text on a dark background), which is hard to read, especially in printed material. Also, if users will be printing the report themselves, reversed-out text requires too much ink, making printing costly.
- Avoid printing text on colored backgrounds unless the background is very light (such as pale yellow). Shading the background reduces contrast and makes the text harder to read. For ease of reading, do not put text on top of photos or patterned backgrounds.
Make It Easy To Navigate the Report and Pick Up the Main Points
- To guide people smoothly through your report, use text and graphics in combination to give clear, consistent navigation signals.
- These signals help people notice what’s in the report and help them find the parts of personal interest without distracting or misleading them.
- Use plenty of informative headings and subheadings. Make them pop out for easy skimming by creating a strong contrast between the text and the headings and leaving enough space around the headings.
Be consistent.
- Consistent design helps orient people, facilitates skimming, and enables easy navigation through the report.
- Keep the overall page layout and design features consistent
- Although each page in your report may have different content, the basic design should be consistent. Keep the formatting of titles, headings, bulleted lists, labels, and other text the same throughout the report (same font, size, color, and so on).
- Provide persistent navigation links for the main headings and keep them in the same position on each page.
Looking for help building insightful reports in HubSpot?
Contact us and we can assist you in building impactful campaigns and insightful reports to help track your campaign conversions.